
Request history
Request history helps you see whether a client interaction completed and what Stravia recorded along the way. It is the place to inspect an individual interaction; Usage is the separate view for upstream-reported quantities.
Prerequisites
Send a request to this Server instance and sign in to its management interface. A generated client configuration alone does not create a request-history entry.
Steps to find and verify an interaction
- Open Request history after sending a client request.
- Set or refresh the time range that includes that request.
- Find the interaction using its Model ID and status.
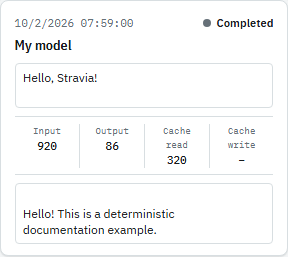
- Open it to review available input/output previews, request stages, attempts, and tool activity.
Troubleshoot a missing interaction
No matching row does not prove that a request was never sent. Check the time range and filters, the endpoint that received the request, and the interaction status.
Interpret recorded details
The record can contain more than a final answer: depending on the interaction, it may show readable request content, model turns, target attempts, retries, tool activity, failures, and reported usage. A missing or dashed usage value is unknown or unavailable, not zero.
Understand debug capture
Ordinary request observations and the process-level debug capture are different. When debug capture is enabled, the captured scope can include wire-level HTTP/SSE/WebSocket traffic for admitted inference runs; it is not a packet capture. Only the value of HTTP Authorization headers is permanently redacted. Other headers, URLs, bodies, prompts, attachments, or credentials may remain.
An exported debug bundle may be incomplete, with missing capture ranges. Treat it as sensitive: review, minimize, and sanitize the data in a trusted environment before sharing. Do not attach it unreviewed to a public issue.
Next steps
Use Usage and allowances for summaries. For troubleshooting, start from the observed symptom .